


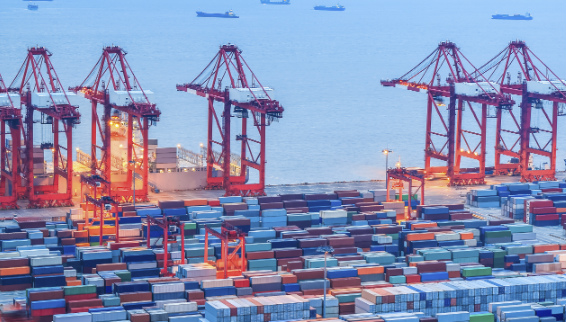
Behind every container ship docking at a major hub lies an often-invisible industry: global terminal operators. These companies develop, manage, and invest in the cranes, berths, yards, gates, rail links, and digital systems that transform ships into supply-chain nodes. A recent LinkedIn post by Shiportrade correctly highlights their central role: shipping lines move cargo between ports, but terminal operators make the port interface itself function. The bigger picture is starker still—ships move global trade, ports connect it, and a concentrated group of operators keeps those connections running.
That concentration is intensifying. According to Drewry’s Global Container Terminal Operators Annual Review and Forecast 2026/27, the world’s 19 global terminal operators (GTOs) raised their equity-adjusted share of container throughput to 49.9% in 2025, up from 48.8% the prior year. Global port volumes rose 6.5% to 994 million TEU; GTOs outperformed with average equity-adjusted growth of 8.9%. They also increased capital spending by 23%, focusing on portfolio expansion, infrastructure upgrades, automation, and digital capabilities. Eight operators posted double-digit growth. Forecasts point to roughly 186 million TEU of additional capacity by 2030 (with some double-counting from joint ownership).
The Hierarchy of Control
Rankings depend on the metric. Equity-adjusted throughput—the cleaner measure of economic interest—consistently places PSA International of Singapore at the top, with around 67–70 million TEU in recent years and 2025 equity-adjusted volume reported at 69.9 million TEU (+5.3%). Chinese state-linked players follow closely: COSCO Shipping Ports and China Merchants Ports typically occupy the next two spots, each in the low-to-mid 50 million TEU range on an equity basis. Hutchison Ports (CK Hutchison), DP World, APM Terminals (Maersk), Terminal Investment Limited (TiL, MSC-backed), and CMA CGM’s terminal arms round out the upper tier. Gross throughput paints a different picture—DP World’s network has been cited near 110 million TEU—because it counts total activity at terminals where an operator holds any stake.
Geographic reach reinforces the oligopoly. DP World and MSC Group hold investments across all 10 world regions. APM Terminals, Hutchison Ports, CMA CGM, and ICTSI operate in nine; PSA in eight (notably absent from Africa and Oceania). No operator meaningfully widened its footprint between 2024 and 2025, yet M&A and selective greenfield projects continue to reshape stakes. Recent entrants such as AD Ports and Adani, alongside hybrid carrier-linked operators, have accelerated expansion.
Ownership models matter as much as scale. Independent stevedores (PSA, historically Hutchison), carrier-affiliated hybrids (APM Terminals, TiL, CMA CGM terminals), and state-owned or state-linked entities (PSA via Temasek, DP World via Dubai, COSCO and China Merchants) dominate. State ownership—particularly Chinese—has grown in prominence, reflecting both commercial ambition and strategic statecraft. Chinese firms have accumulated stakes or operations at a large share of the world’s top container ports, amplifying influence over chokepoints.
Why This Concentration Matters
Terminal operators control physical bottlenecks and the data flows that govern them. Efficient interfaces reduce dwell times, cut costs, and improve reliability for shippers. Inefficient or capacity-constrained ones cascade delays inland via trucks, rail, and warehouses. Carrier-linked operators gain prioritization advantages for their own vessels and can justify heavier capital spending because volumes are partially captive. Independent operators compete on pure terminal performance and third-party openness.
Strategic risks are real. Ports sit at the intersection of commercial logistics and national security. Past episodes—DP World’s forced U.S. asset sales, COSCO’s expanded control at Piraeus, stalled or contested deals involving Hutchison assets in Panama and elsewhere—illustrate how governments treat terminal control as more than a commercial question. Data platforms, automation systems, and preferential treatment of affiliated carriers raise questions about resilience, transparency, and geopolitical leverage. All major GTOs have net-zero targets (2040–2060), initially emphasizing efficiency and later renewable power, yet the transition itself requires sustained capital and coordination.
Shippers and policymakers should watch more than headline rankings. Equity stakes reveal true economic exposure and influence. Gross capacity signals congestion risk at specific gateways. Schedule reliability, dwell times, berth productivity, and inland connectivity often matter more day-to-day than global TEU league tables. Diversification of operators across a trade lane reduces single-point exposure; concentration in a few hands can amplify systemic shocks—whether from labor disruption, cyber events, geopolitical friction, or climate impacts.
The Quiet Infrastructure of Everyday Commerce
The Shiportrade observation is ultimately correct: global port infrastructure is a network, not a collection of isolated facilities. The companies that operate its critical nodes determine how efficiently factories connect to markets. As GTO market share approaches half of global container throughput and capital continues to flow into automation and expansion, the industry’s structure will shape trade resilience for the next decade. Policymakers, shippers, and carriers alike need clearer visibility into ownership, performance metrics, and contingency options. The cranes and yards may be out of sight for most consumers, but the operators who run them sit at the heart of modern commerce.