


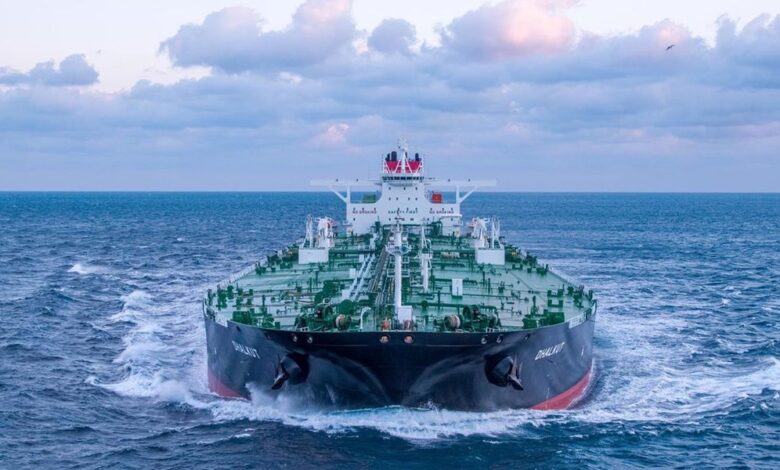
The global shipping market has entered territory that even veteran operators struggle to comprehend. Clarksons’ ClarkSea Index, the industry’s broadest earnings benchmark, has posted a third consecutive all-time high at $66,421 a day — up another 3 percent in a single week and more than 50 percent since the end of August. It now stands nearly three times its long-term average, while the 2026 year-to-date average runs 60 percent above the same period last year. Across tankers, gas carriers, dry bulk, containers, and even the niche car-carrier segment, rates are described by Clarksons as “exceptional or strong.”
Alex Saverys, chief executive of the Belgian tanker group CMB.TECH, captured the mood with unusual candour in the Financial Times: “In 50 years, we’ll be looking back on 2026. This is truly a unique situation. I don’t think I’ll ever see a market like this again in my lifetime. It’s a once-in-a-generation event.”
He is almost certainly right. What we are witnessing is not a conventional cyclical upswing driven by strong demand growth. It is a structural dislocation powered by geopolitics, route diversions, port congestion, and the simple physics of longer voyages consuming more vessel capacity. The result is a transfer of wealth of historic proportions — from cargo owners and consumers to shipowners — for as long as the disruptions persist.
Tankers: The Primary Engine of Extremes
Crude tankers remain the dominant force. Global VLCC earnings averaged above $600,000 a day last week; voyages linked to the Strait of Hormuz have reached $800,000 to $1.5 million a day. MB Shipbrokers reports eco-VLCC spot earnings at $740,692, with suezmaxes at $334,811 and aframaxes at $205,170. Ship-to-ship crude movements through Hormuz have climbed above 7.5 million barrels per day. Freight now equates to roughly 15 percent of the value of a barrel of oil, against a historical norm of about 2 percent.
These numbers are not the product of soaring oil demand. They reflect elevated Middle East operational risk, reduced Atlantic ballasting availability, and Asian refiners reaching further afield for barrels. Every extra day a vessel spends in transit or waiting is capacity that cannot be used elsewhere. The market is rationing itself through price.
Gas, Dry Bulk and Containers: The Same Logic, Different Cargoes
The phenomenon is not confined to tankers. Very large gas carriers have also set records. Houston–Japan earnings recently touched about $189,700 a day; Middle East Gulf–Japan rates climbed above $219,000. Tight vessel availability and disrupted energy flows are the common denominators.
Dry bulk tells a particularly revealing story. Maritime Strategies International expects dry bulk trade itself to grow only 2.2 percent in 2026. Yet required deadweight demand is projected to rise 4.9 percent. The gap is explained by higher ballast ratios, port delays, and the ongoing diversions around the Suez and Panama canals. Effective fleet capacity is being consumed by inefficiency rather than by growth in tonnes moved.
Containers display the same disruption dividend. Sea-Intelligence calculates that 8.5 percent of the global containership fleet — around 3 million teu — is currently absorbed by delays, against a pre-pandemic baseline of 2.2 percent. Congestion is not expected to clear fully before the Chinese New Year peak in January. Car carriers, a smaller component of the ClarkSea Index, are also trading near record freight levels.
In each case, the underlying trade volumes are not extraordinary. What is extraordinary is the amount of shipping capacity required to move them.
Implications Beyond the Freight Market
For shipowners, the arithmetic is simple and lucrative. Earnings multiples of this magnitude generate cash flows that can retire debt, fund fleet renewal, or return capital to shareholders at rates rarely seen outside wartime or acute crisis. For energy consumers and importers, the reverse is true. Freight that once represented a rounding error now materially affects the delivered cost of oil, LPG, and bulk commodities. That feeds directly into inflation and industrial competitiveness, particularly for Asian economies heavily reliant on long-haul energy imports.
The situation also exposes a deeper vulnerability in the global trading system. Chokepoints — Hormuz, Suez, Panama — and the cascading effects of conflict or weather have always mattered. What 2026 demonstrates is how quickly those frictions compound when several occur at once. The market is currently pricing extreme scarcity of effective capacity.
Should diplomatic or military developments ease tensions around key waterways, or should a wave of newbuildings finally arrive in volume, the correction could be sharp. Conversely, if disruptions prove sticky, elevated rates may persist longer than many assume.
What This Means for African Importers
The windfall for shipowners is a direct tax on African importers. The mechanics are brutally straightforward: when global freight rates triple, the cost lands on the invoice of the trader in Mombasa or Lagos, not the shipowner in Athens or Singapore.
East Africa is already the world’s most expensive place to move a container by land — about $1.8 per kilometre, nearly double the global average of $1, according to the Shippers Council of Eastern Africa. That figure could rise to $2.1 as transporters pass on higher fuel costs. In Kenya, transporters have announced a 14 percent rate increase, while Kenya Railways has introduced a fuel price adjuster that would push tariffs up 12 percent if diesel reaches the upper trigger band.
The maritime surcharges are steeper still. Maersk’s peak-season surcharge on China–East Africa routes now stands at $1,000 for a 20-foot container and $2,000 for a 40-foot container bound for Mombasa or Dar es Salaam — a near-doubling from $1,100 for the 40-foot box. MSC imposed war-risk surcharges of $2,000 per 20-foot and $4,000 per 40-foot container from Gulf origins to Africa. Freight rates from Asia to East Africa have already risen from around $1,500 per container to over $6,000, with transit times stretched by 14 to 21 days.
These are not marginal adjustments. Freight already constitutes about 10 percent of the value of imports in developing countries, against 3 percent in developed ones. For landlocked economies the burden is crushing: over 20 percent for Rwanda, 24 percent for Mali, 23 percent for Niger. A sustained doubling of maritime freight threatens to add several percentage points to those figures, eating directly into the foreign exchange reserves of countries that can least afford it.
The macroeconomic consequences are already visible. The African Development Bank’s 2026 outlook projects African per capita GDP growth falling from 2.1 percent in 2025 to 1.9 percent in 2026, with East Africa’s growth dropping from 6.6 percent to 5.9 percent. Average African inflation is forecast at 10.4 percent, 0.9 percentage points above earlier projections, as fuel and freight costs feed through to food, fertiliser, and manufactured goods. Twenty-seven African currencies have depreciated against the dollar, amplifying the local-currency cost of dollar-denominated freight and imports.
The structural vulnerability is not new, but 2026 has exposed it with unusual clarity. Africa accounts for just 6 percent of global maritime trade and owns about 1.2 percent of the global fleet by vessel count. The continent sits astride the world’s most important maritime chokepoints — Suez, Bab el-Mandeb, Hormuz — yet has almost no capacity to shape the terms on which it uses them. When war-risk premiums spike 500 to 1,000 percent overnight, as they did when the Red Sea was declared a war zone, African importers absorb the cost without any offsetting mechanism.
For landlocked economies on the Northern Corridor — Uganda, Rwanda, Burundi, South Sudan, eastern DRC — the pain compounds with distance. A $5,000 security levy or a 14-day wait at Mombasa is enough to reroute a contract permanently. Uganda has kept both Mombasa and Dar es Salaam options open; South Sudan has shifted formally toward the Central Corridor. Every dollar added to freight is another argument for abandoning the Kenyan gateway.
The irony is sharp. The same disruptions that have generated record earnings for shipowners — longer voyages, route diversions, port congestion — are precisely the inefficiencies that make African trade more expensive. The continent pays for the friction twice: once as a consumer of imported goods, and again as an exporter rendered less competitive by higher transport costs. African importers are not participants in this boom. They are its collateral.
A Market Defined by Friction, Not Fundamentals
This is not a boom built on robust demand growth. It is a boom built on friction. The ClarkSea Index at three times its long-term average is the visible price of that friction.
Saverys is correct that such conditions are generational. History suggests they are also temporary. The industry’s challenge — and the wider economy’s — is that “temporary” can last long enough to reshape balance sheets, trade patterns, and energy security calculations.
For now, the message from the freight markets is unambiguous: the cost of moving the world’s energy and goods has been rewritten by geopolitics and operational inefficiency. Shipowners are collecting the rent. Everyone else is paying it. How long that arrangement lasts will depend less on tonne-mile demand than on whether the world’s critical maritime arteries can be restored to something resembling normal function. Until then, 2026 will continue to look like the outlier year that future textbooks will study.